Job Burnout Traffic Lights for Work Communities
The survey is used to map the risk of job burnout at the organizational level. The tool provides a clear overview of the identification of job burnout and its prevalence in different units, as well as recommendations for measures to promote well-being. Data on the prevalence of burnout among the Finnish working-age population is presented for comparison.

Duration: 5 minutes to respond + summarizing results and development measures.
Contents: 12 questions related to symptoms of burnout (exhaustion, mental distancing, cognitive impairment and emotional impairment).
Result: Results of the organisation compared to results of the How is Finland doing? study.
- For whom?
The survey is intended for workplaces that want to identify the existence and prevalence of the risk of burnout. For large workplaces, the survey can also provide information on the prevalence of burnout in different units, if the number of respondents is sufficient to allow protection of the respondents’ privacy. The survey can be carried out regularly, such as twice a year, which allows monitoring the development of strain. This can be particularly useful during various changes at work and for follow-up purposes, for example. - Benefits?
The workplace receives up-to-date information on the prevalence and severity of burnout symptoms among employees and the various units of the workplace. Individual employees are informed of whether they have symptoms of burnout and, if so, the degree of the symptoms. Both the workplace and the individuals receive feedback with instructions on what to do in case of burnout. Based on the results provided by the tool, it is possible to develop working conditions to reduce and prevent burnout.
How to use the survey tool
- Choose a contact person who is responsible for conducting the survey.
- The contact person orders organization-specific survey and report links to their email and sends the survey links to the respondents.
- After completing the survey, the respondents will receive personal feedback on their own situation.
- The contact person can view the results and download a group-level report from which individual respondents cannot be identified.
What do the survey and reports look like?
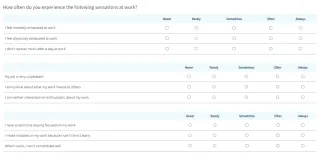
The survey consists of a total of 12 questions related to the four main symptoms of burnout.
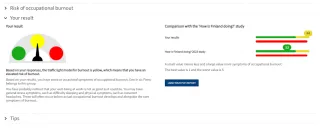
The individual respondent’s report shows their own results, tips for their specific situation and a comparison with the results of the How is Finland doing? study.
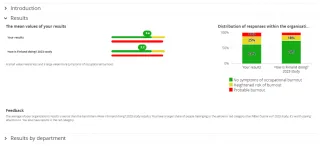
The organization-level report shows the average of the results, a comparison with the How is Finland doing? study, distribution of responses and proposals for measures based on the results.

Ask our experts

Jari Hakanen
Email
Jari.Hakanen [at] ttl.fi
Phone
+358 30 474 2453

Janne Kaltiainen
Email
janne.kaltiainen [at] ttl.fi
Phone
+358 30 474 2668